
What is DPD?
EzeScan’s Data Panel Dashboard (DPD) is a powerful component of the EzeScan WebApp suite, purpose-built to create dashboard(s) that show pertinent information about EWA RIA workflows (such as invoice processing, document processing).
DPD allows information to be displayed in data panels (hence its name).
Data Panels
Single Value
Single value data panels are designed to display a single value to users.

Example SQL Query
select count(*) from [driverDB].[dbo].[Drivers]
Data Table
Data table data panels are designed to display a table of data to users.
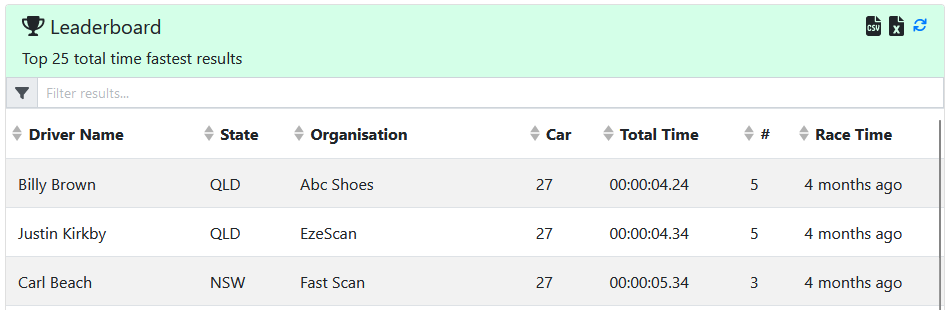
Example SQL Query
SELECT TOP (25)
    [Drivers].[Name] AS 'DriverName',
    [Drivers].[State],
    [Drivers].[Organisation],
    [FastestResult].[Car],
    [FastestResult].[TotalTime] as time(2)) as nvarchar) AS 'TotalTime',
    (Select count(*) from results where Driver = FastestResult.Driver) as #,
    [FastestResult].[DateTime] AS 'RaceTime'
FROM DriversFastestTimes as FastestResult
INNER JOIN [rimpa].[dbo].[Drivers] ON Drivers.ID = FastestResult.Driver
ORDER BY TotalTime
Spacer
A spacer data panel is an invisible element that consumes space that can be used to help position other data panels.
Chart
A chart data panel is designed to display a table of data in a selected chart type.
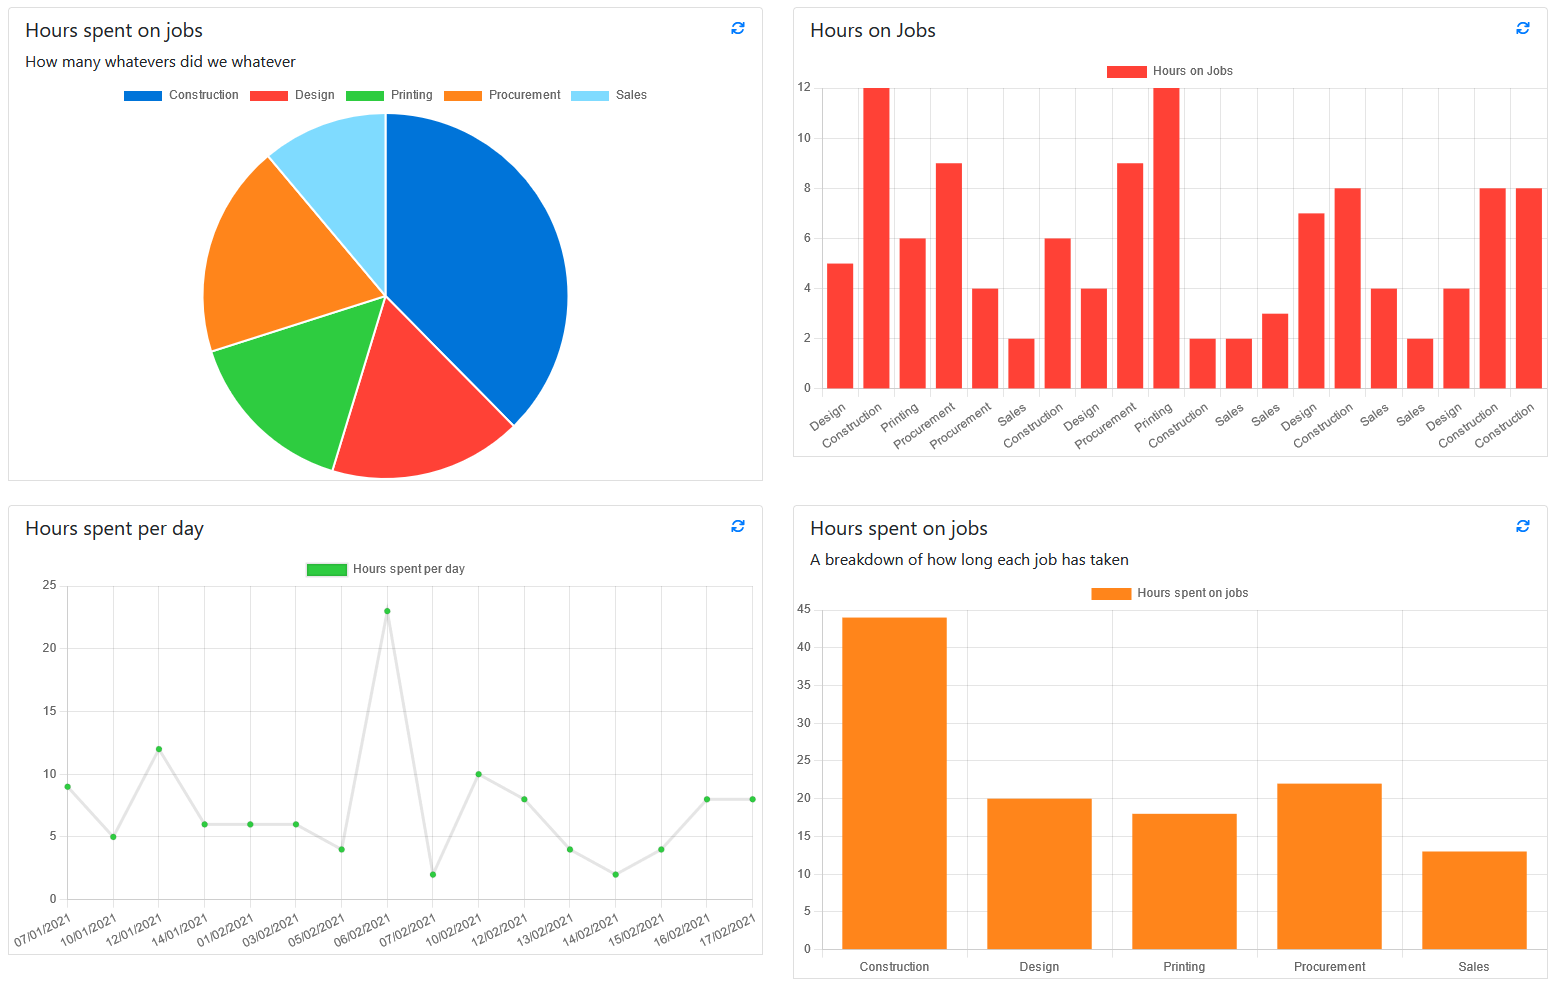
Chart Types
You can select the way the chart will display. The current options are Bar chart, Line chart and Pie chart
They may need specific values in specific orders to correctly render.
Bar
Below is an example of the SQL query and how that will render in a bar chart.
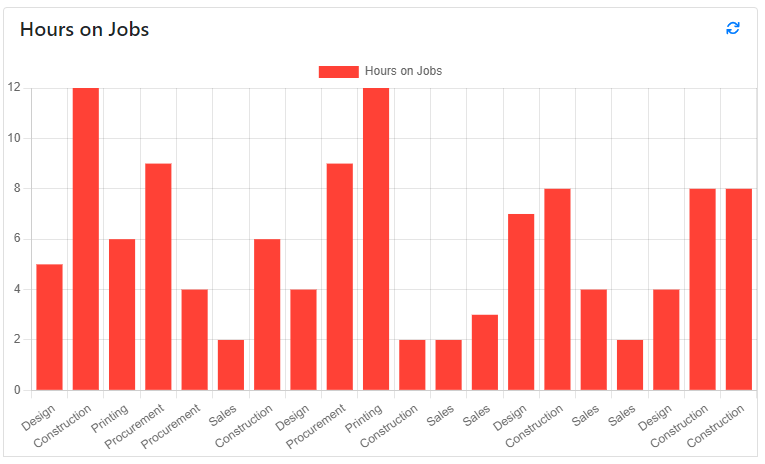
SELECT Job, Hours
FROM sampleNumeric
Line
Below is an example of the SQL query and how that will render in a line chart.
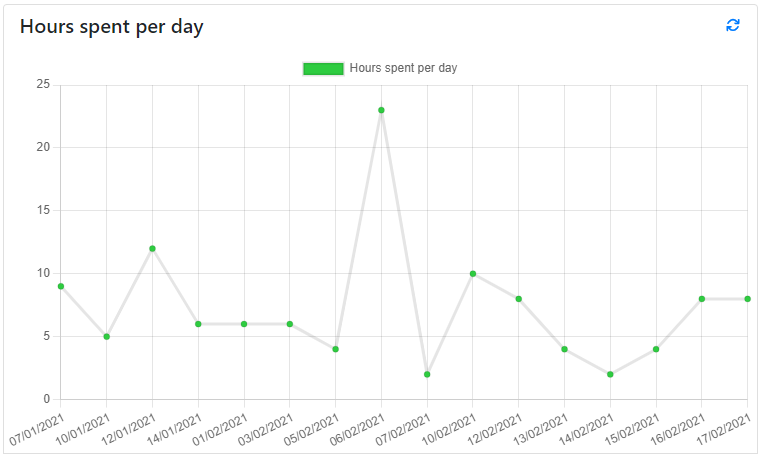
SELECT FORMAT([Date],'dd/MM/yyyy')  as Date, SUM(Hours) AS Hours
FROM sampleNumeric
GROUP BY Date
Pie
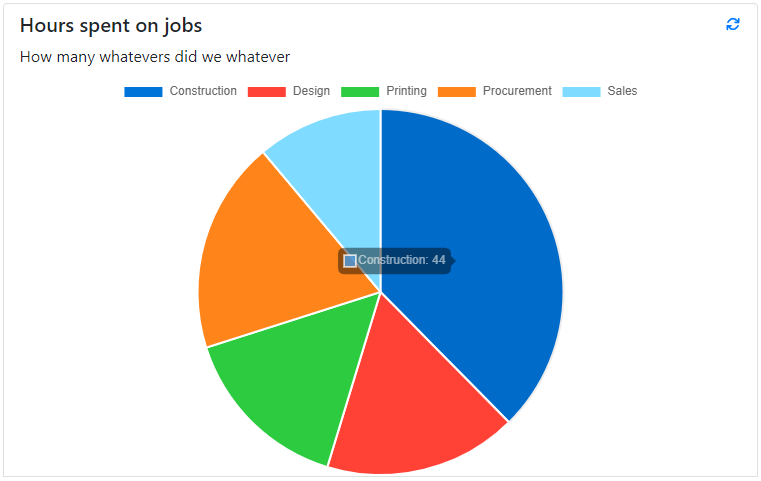
SELECT Job, SUM(Hours) AS Hours
FROM sampleNumeric
GROUP BY Job
Multiple Series
Line and Bar charts can support displaying multiple series of data in the one chart.
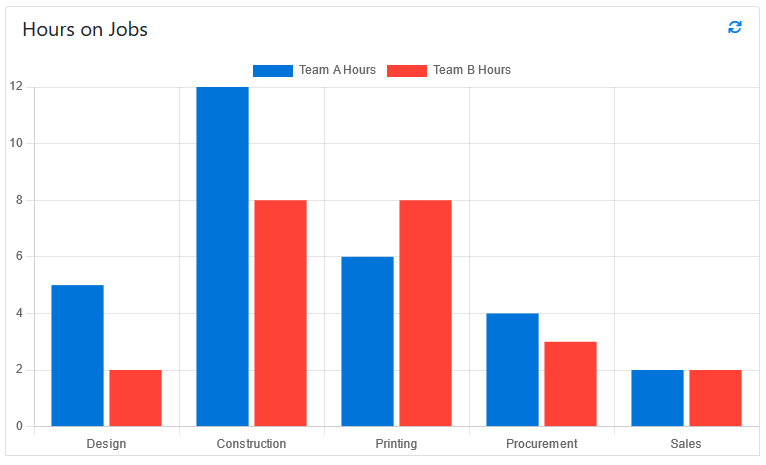
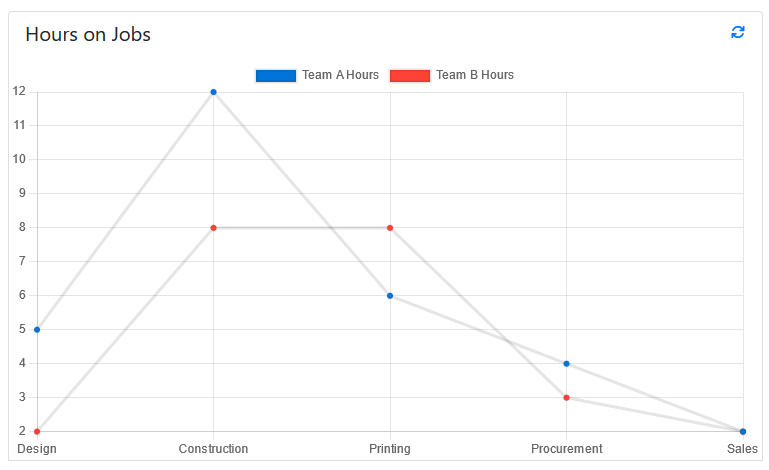
SELECT Job, Team_A_Hours AS "Team A Hours", Team_B_Hours AS "Team B Hours"
FROM sampleNumeric