
Purpose
The Panels tab allows administrators to configure the data panels displayed on the DPD page. There is no limit to the number of panels that can be configured on a DPD page.
Data Panels Types
Single Value
Single value data panels are designed to display a single value to users.
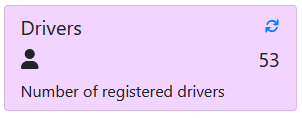
Example SQL Query
select count(*) from [driverDB].[dbo].[Drivers]
Data Table
Data table data panels are designed to display a table of data to users.
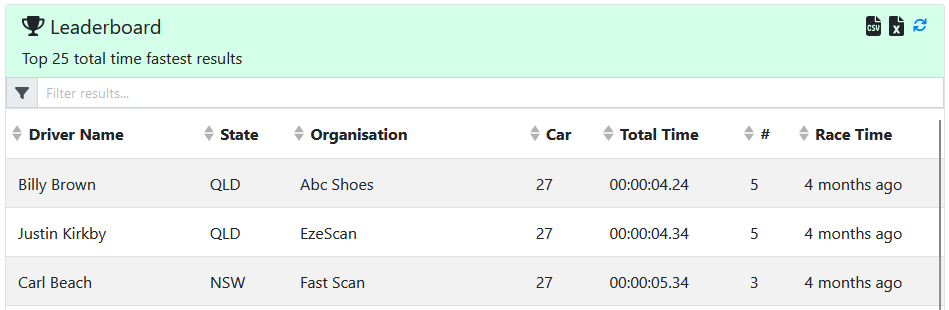
Example SQL Query
SELECT TOP (25)
    [Drivers].[Name] AS 'DriverName',
    [Drivers].[State],
    [Drivers].[Organisation],
    [FastestResult].[Car],
    [FastestResult].[TotalTime] as time(2)) as nvarchar) AS 'TotalTime',
    (Select count(*) from results where Driver = FastestResult.Driver) as #,
    [FastestResult].[DateTime] AS 'RaceTime'
FROM DriversFastestTimes as FastestResult
INNER JOIN [rimpa].[dbo].[Drivers] ON Drivers.ID = FastestResult.Driver
ORDER BY TotalTime
Spacer
A spacer data panel is an invisible element that consumes space that can be used to help position other data panels.
Chart
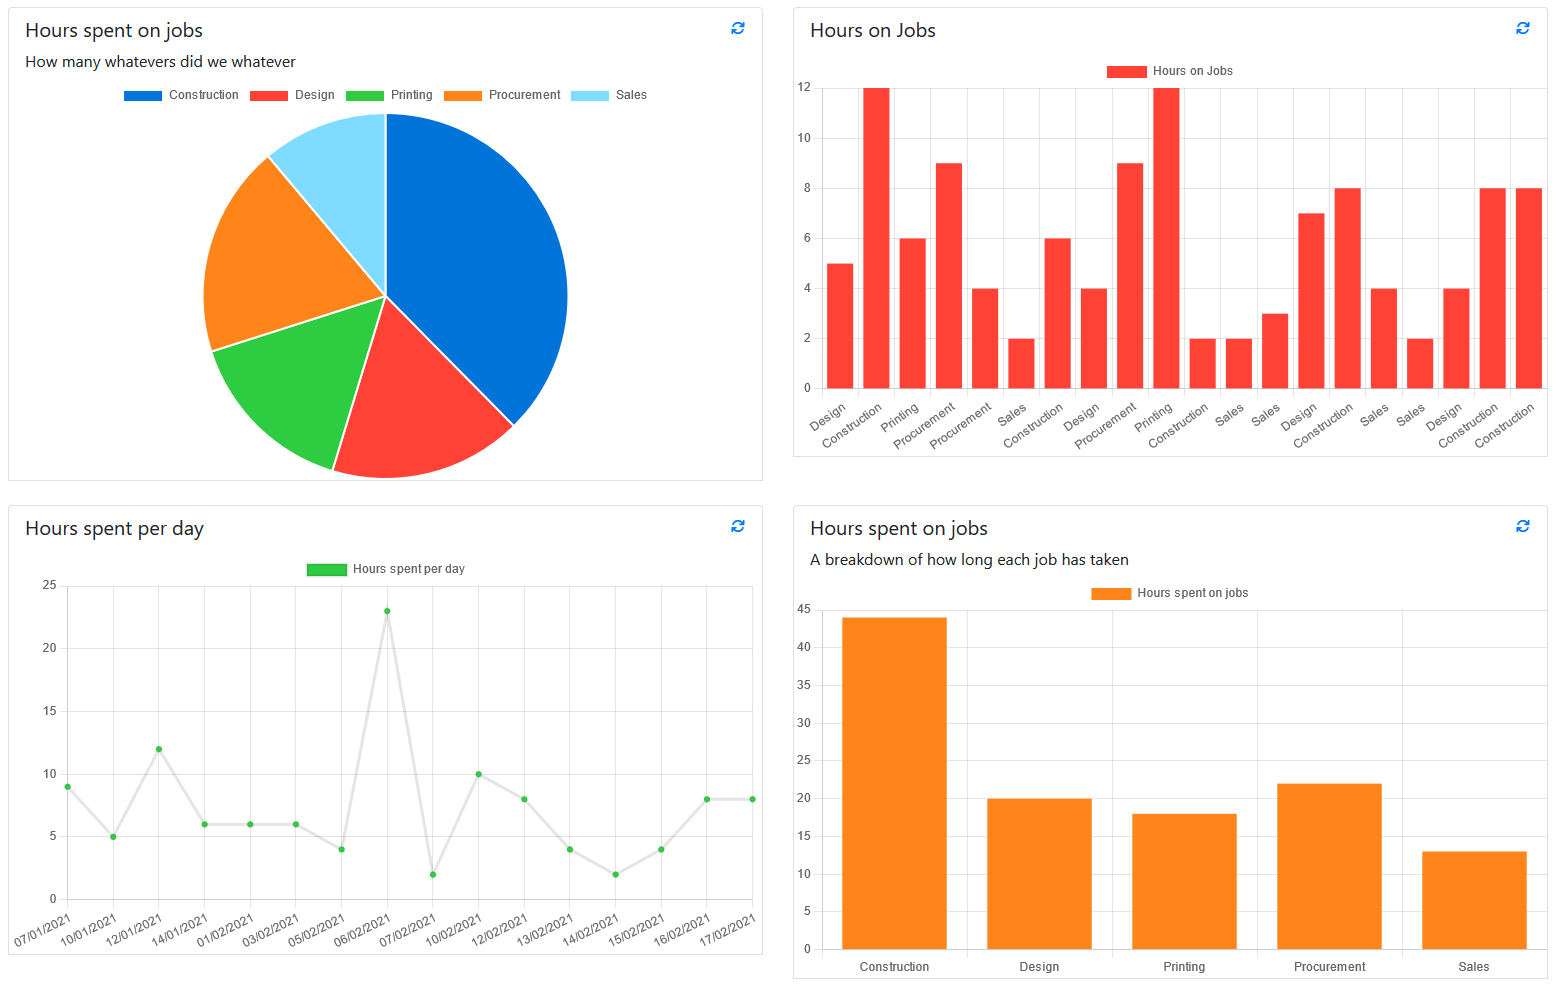
A chart data panel is designed to display a table of data in a selected chart type.
Data Panel Settings
General Tab
|
Field Type |
Description |
|---|---|
|
Name |
Enter a name for the data panel |
|
Description |
Short description for the data panel |
|
Disable Panel |
Ability to enable/disable this panel. The panel is enabled by default. |
Display Tab
|
Field Type |
Description |
|---|---|
|
Icon |
The icon to display for the data panel |
|
Font Colour |
The colour of the font in the panel. |
|
Panel Colour |
The colour for the data panel. For a single value this will cover the entire panel. For a table or chart this colour is retained to the data panel heading. 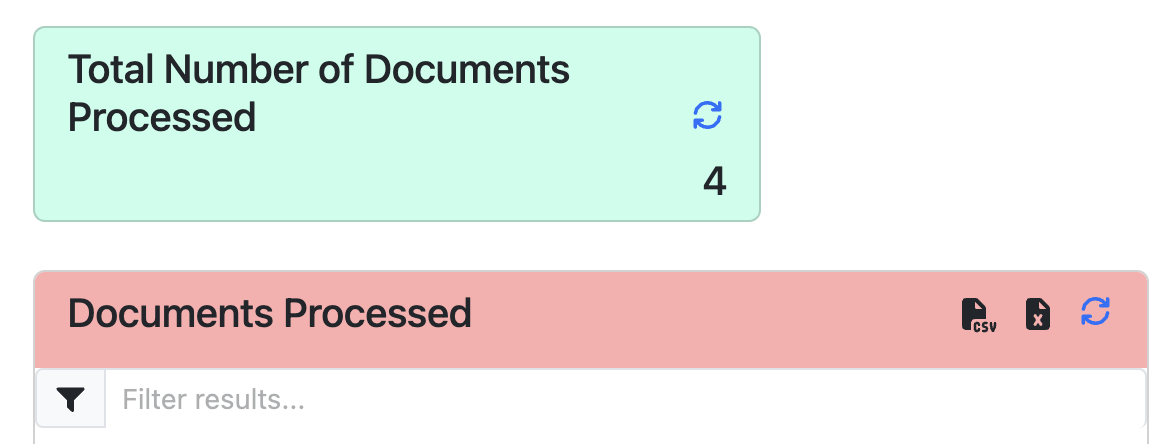
|
|
Column Span |
Number of columns to span. The total width of a full width page is 6 columns. |
|
Row Span |
Number of rows to span |
Connection Tab
|
Field Type |
Description |
|---|---|
|
Provider Type |
The datebase type that the data is stored in: OBDC, SQL or Authority Server. |
|
Data Query |
The data query to run. This query can be configured in the Connections page. |
|
Refresh Rate |
Number of seconds in-between each automatic refresh (0 means the data won't automatically refresh) |
|
Enable Exporting |
Toggle to enable exporting of data in the data table. Only appears for Data Tables. This is toggled on by default. |
|
Result page size |
Number of results to display in the table. Only Applicable for Data Tables. |
Chart Tab
Chart Types
You can select the way the chart will display. The current options are Bar chart, Line chart and Pie chart
They may need specific values in specific orders to correctly render.
Bar
Below is an example of the SQL query and how that will render in a bar chart.
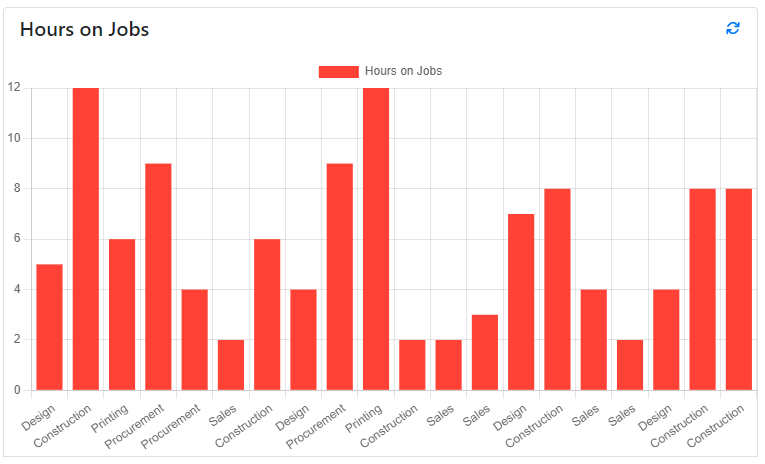
SELECT Job, Hours
FROM sampleNumeric
Line
Below is an example of the SQL query and how that will render in a line chart.
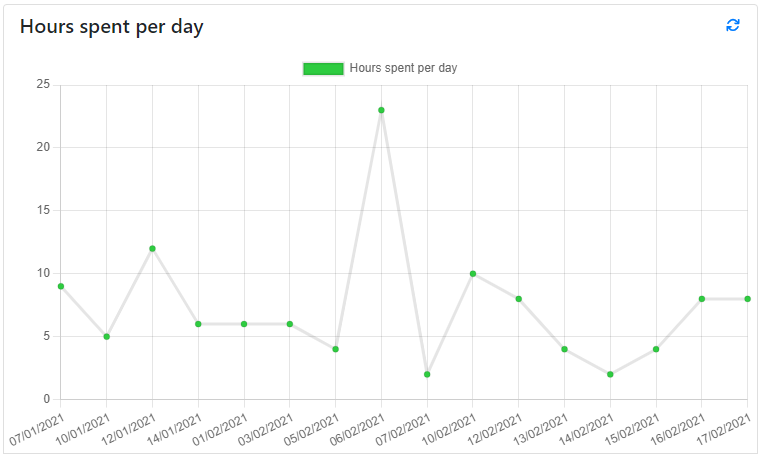
SELECT FORMAT([Date],'dd/MM/yyyy')  as Date, SUM(Hours) AS Hours
FROM sampleNumeric
GROUP BY Date
Pie
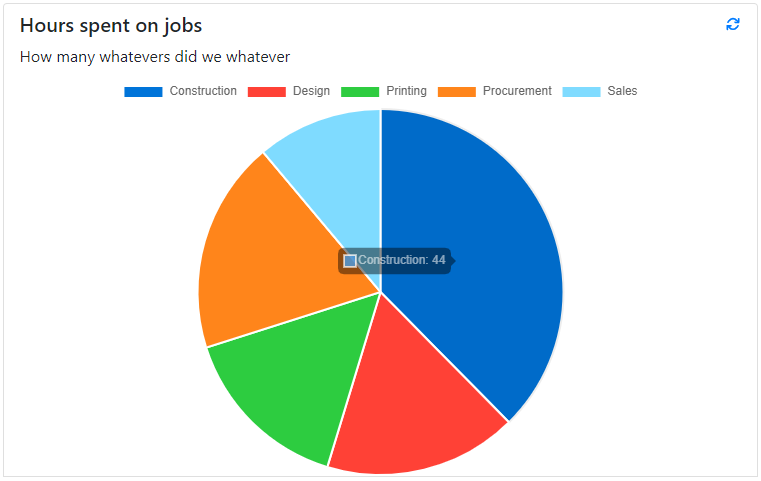
SELECT Job, SUM(Hours) AS Hours
FROM sampleNumeric
GROUP BY Job
Multiple Series
Line and Bar charts can support displaying multiple series of data in the one chart.
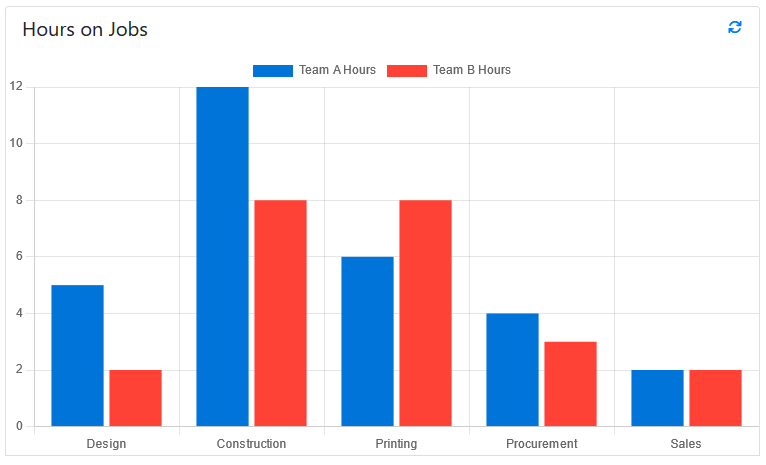
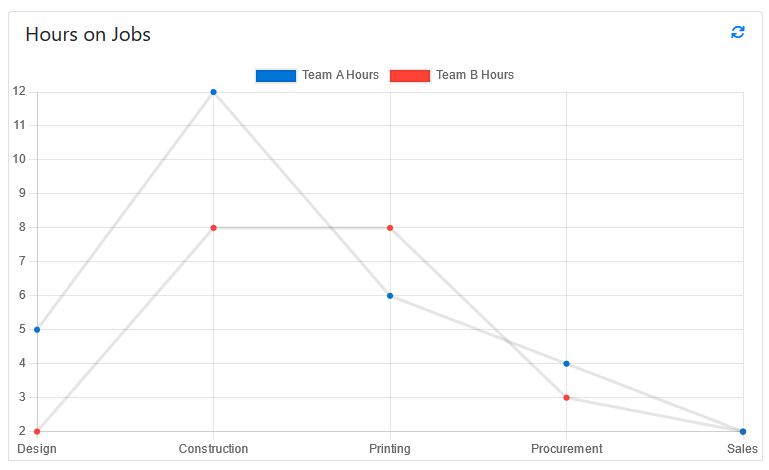
SELECT Job, Team_A_Hours AS "Team A Hours", Team_B_Hours AS "Team B Hours"
FROM sampleNumeric