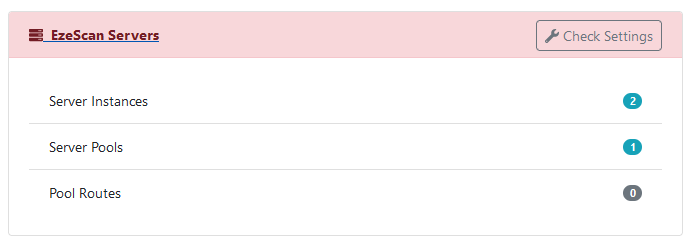
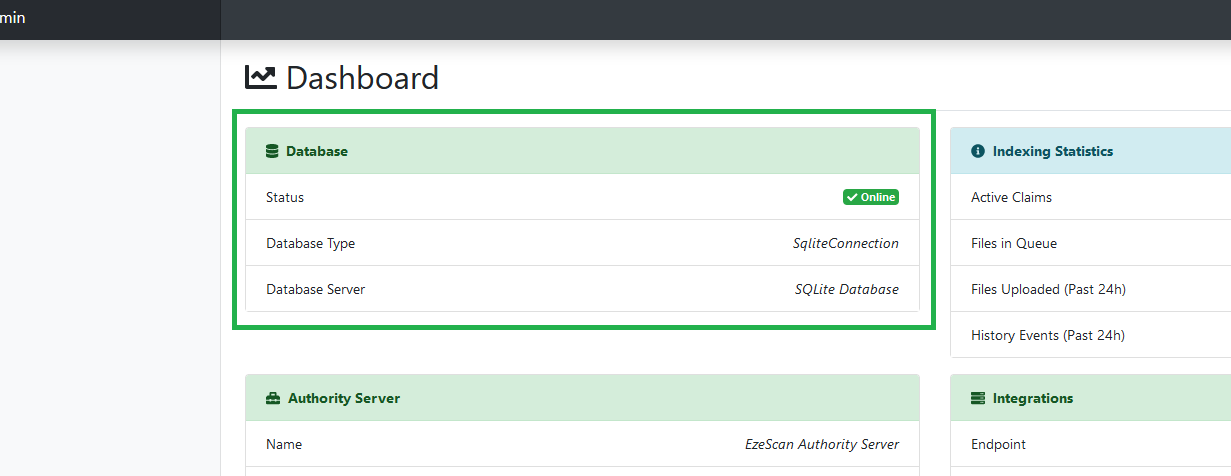
The dashboard provides information panels that provide an overview of the health of the installation.
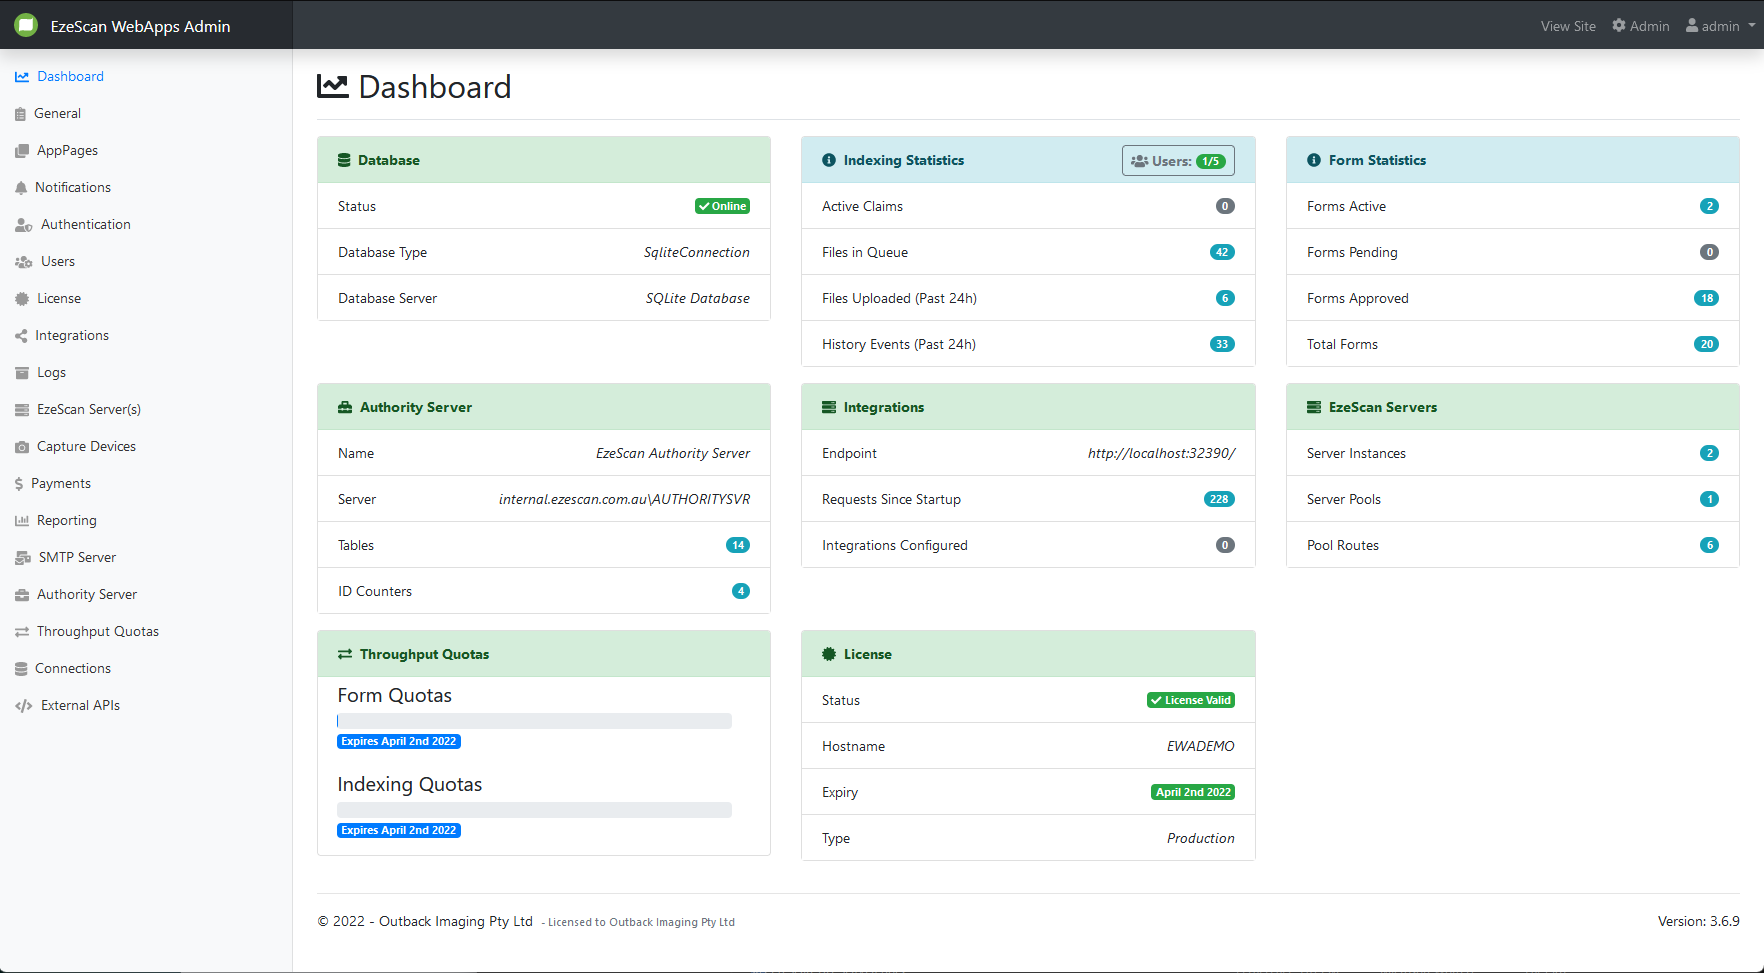
Clicking on the panels will take you to the relevant configuration page for that specific part of the application.
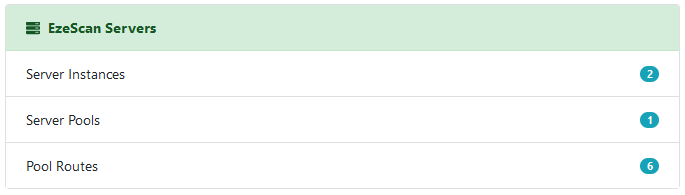
A green panel indicates that everything is operating as normal.
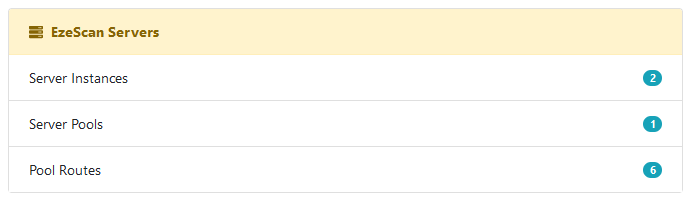
These are generally non critical issues but the application is most likely still functioning correctly and should be investigated.
These are generally critical errors that will stop the application from functioning correctly and should be rectified immediately.
Database Management
Clicking on the Database panel will take you to the Database Management screen.
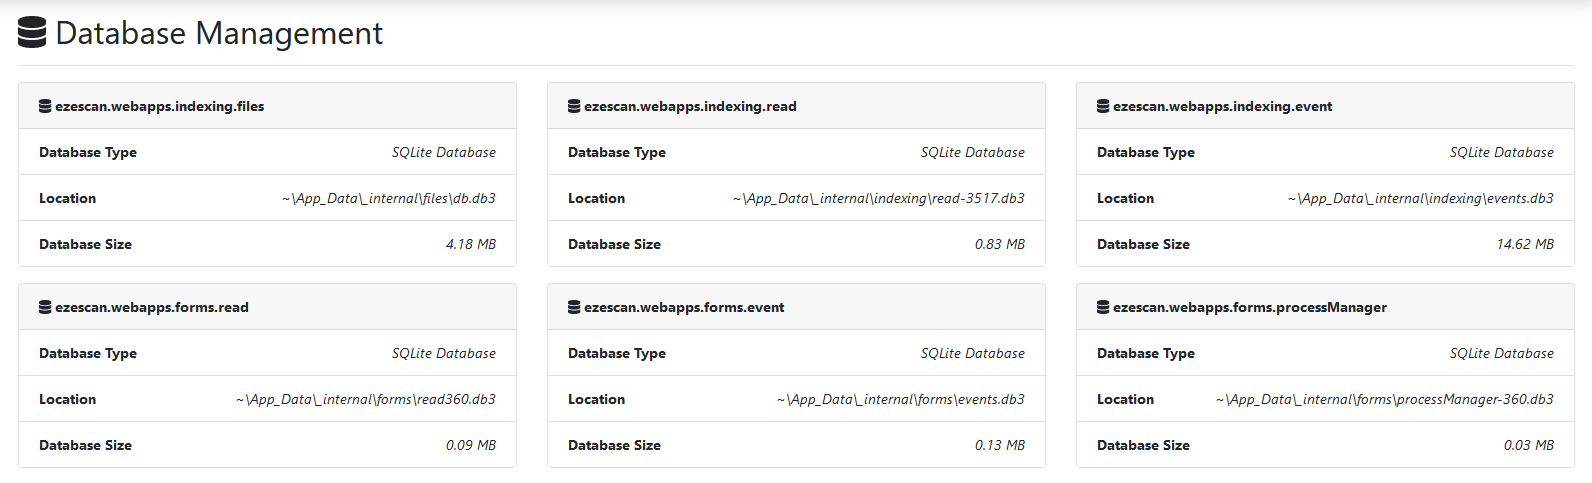
If your databases are running using Microsoft SQL server then you will get additional options to view and reorganise indexes.
Concurrent Users
Clicking on the "Users" button in the top right of the Indexing Statistics panel will take you to the Concurrent Users screen.
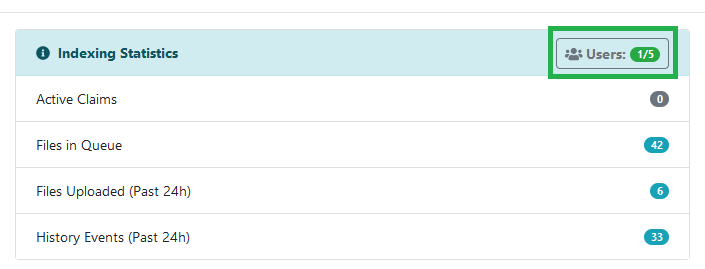
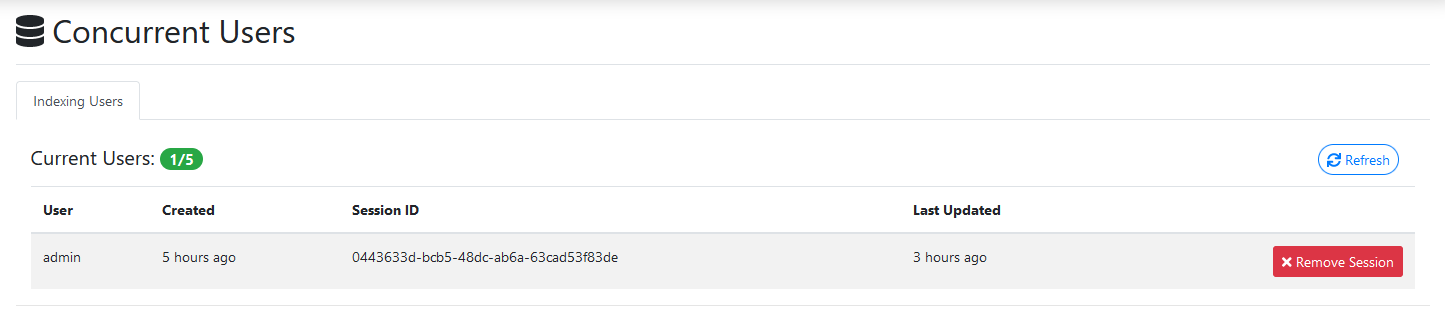
This screen will show all of your active indexing sessions and allows an administrator to terminate a users session by clicking the Remove Session button.
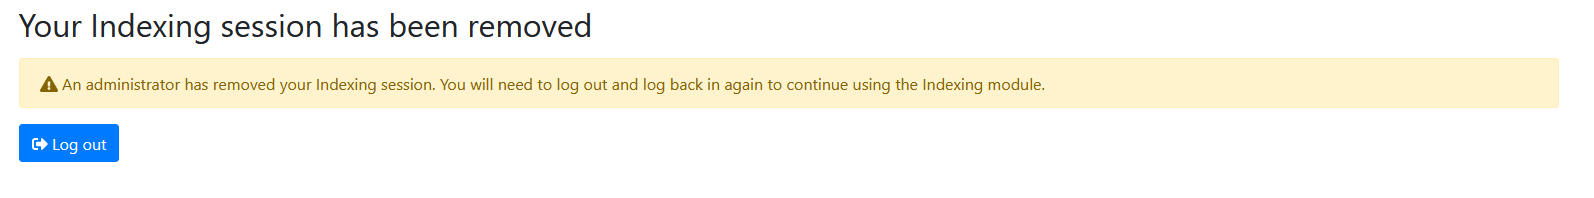
Once a users session is removed they will need to log out and log back into the application to remove the disposed session.
The user will see the following screen until they log out and log in.