
This page shows you how to enable and disable debug logging. This is useful for troubleshooting issues as it will provide detailed information on what is happening behind the scenes.
It is recommended to set back to "Information" when the debugging is completed as "Debug" will create larger log files and more load on the server.
Steps to enable debugging
-
Navigate to the EzeScan WebApps home page using a supported browser.
-
Login as an Admin user.
-
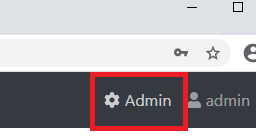
In the top right click the Admin link to open the Admin Panel.
-
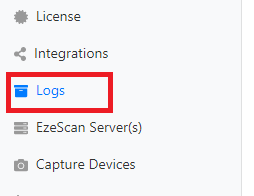
On the left menu click the Logs link.
-
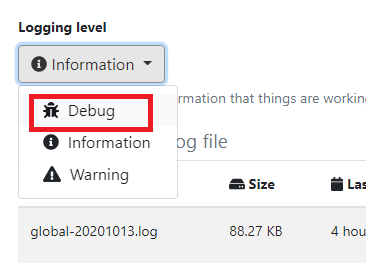
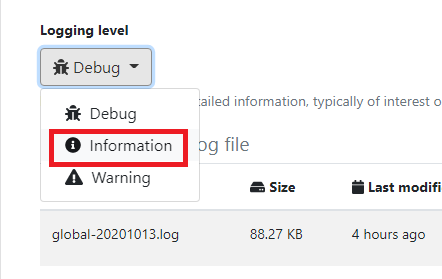
Change the Logging Level to Information.
-
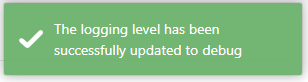
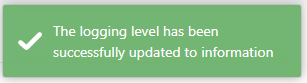
In the top right confirm you see a success notification.
Steps to disable debugging
-
Navigate to the EzeScan WebApps home page using a supported browser.
-
Login as an Admin user.
-
In the top right click the Admin link to open the Admin Panel.
-
On the left menu click the Logs link.
-
Change the Logging Level to Information.
-
In the top right confirm you see a success notification.
Steps to enable debug logging when unable to access the admin panel
-
Add the following code to the appsettings.json file:
"Logging": {
"LogLevel": {
"Default":"Information",
"Microsoft":"Warning",
"Microsoft.Hosting.Lifetime":"Information"
}
},
"Serilog": {
"MinimumLevel":"Debug"
},
LikeBe the first to like this